

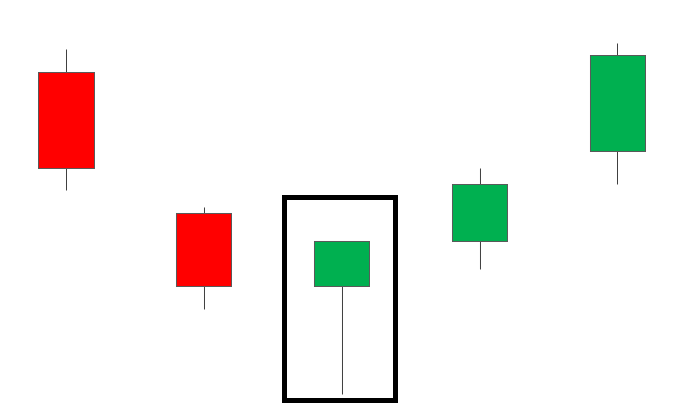
A bullish harami is a candlestick pattern that often signals a potential reversal of a downtrend. It consists of two candlesticks, where the first candlestick is a large bearish (downward) candle, followed by a smaller bullish (upward) candlestick that is completely engulfed within the range of the previous candle. The term “harami” is Japanese for “pregnant,” which aptly describes the pattern’s visual resemblance to a pregnant woman, with the smaller candle nestled within the larger one.
Here’s how to identify and interpret a bullish harami pattern:
- First Candlestick: The first candlestick in a bullish harami pattern is a relatively large bearish candle, indicating downward pressure in the market. The size of this candle can vary, but it should ideally have a long body, signifying a significant move in the direction of the prevailing trend.
- Second Candlestick: The second candlestick is a smaller bullish candle that forms within the high and low range of the previous bearish candle. This smaller candle may have a body that is either bullish or bearish, but its size is typically smaller compared to the first candlestick.
- Interpretation: The formation of a bullish harami suggests that selling pressure may be weakening, as indicated by the smaller bullish candlestick engulfed within the larger bearish candle. It implies that buyers are beginning to step in, potentially signaling a shift in momentum from bearish to bullish.
- Confirmation: While a bullish harami can be a bullish reversal signal on its own, traders often look for additional confirmation before entering a trade. This confirmation may come in the form of bullish price action following the pattern, such as a strong bullish candle or an increase in trading volume.
- Risk Management: As with any trading signal, it’s essential for traders to manage their risk effectively. This may involve setting stop-loss orders to limit potential losses if the anticipated reversal does not materialize or adjusting position sizes based on risk tolerance.
Overall, a bullish harami pattern can be a useful tool for traders seeking to identify potential trend reversals in the market. However, like any technical indicator or pattern, it should be used in conjunction with other analysis and risk management techniques for optimal results.
